Unveiling the inner world of the activated carbon
Activated carbon, produced by heating organic matter in the absence of oxygen and then undergoing activation, is an incredibly versatile material with applications ranging from soil improvement and water purification to energy storage. While our colleagues from the Latvian State Institute of Wood Chemistry have provided valuable insights into surface area, pore volume, and pore size distribution, we at the Institute of Solid State Physics, University of Latvia (ISSP UL) see beyond the carbon’s surface.
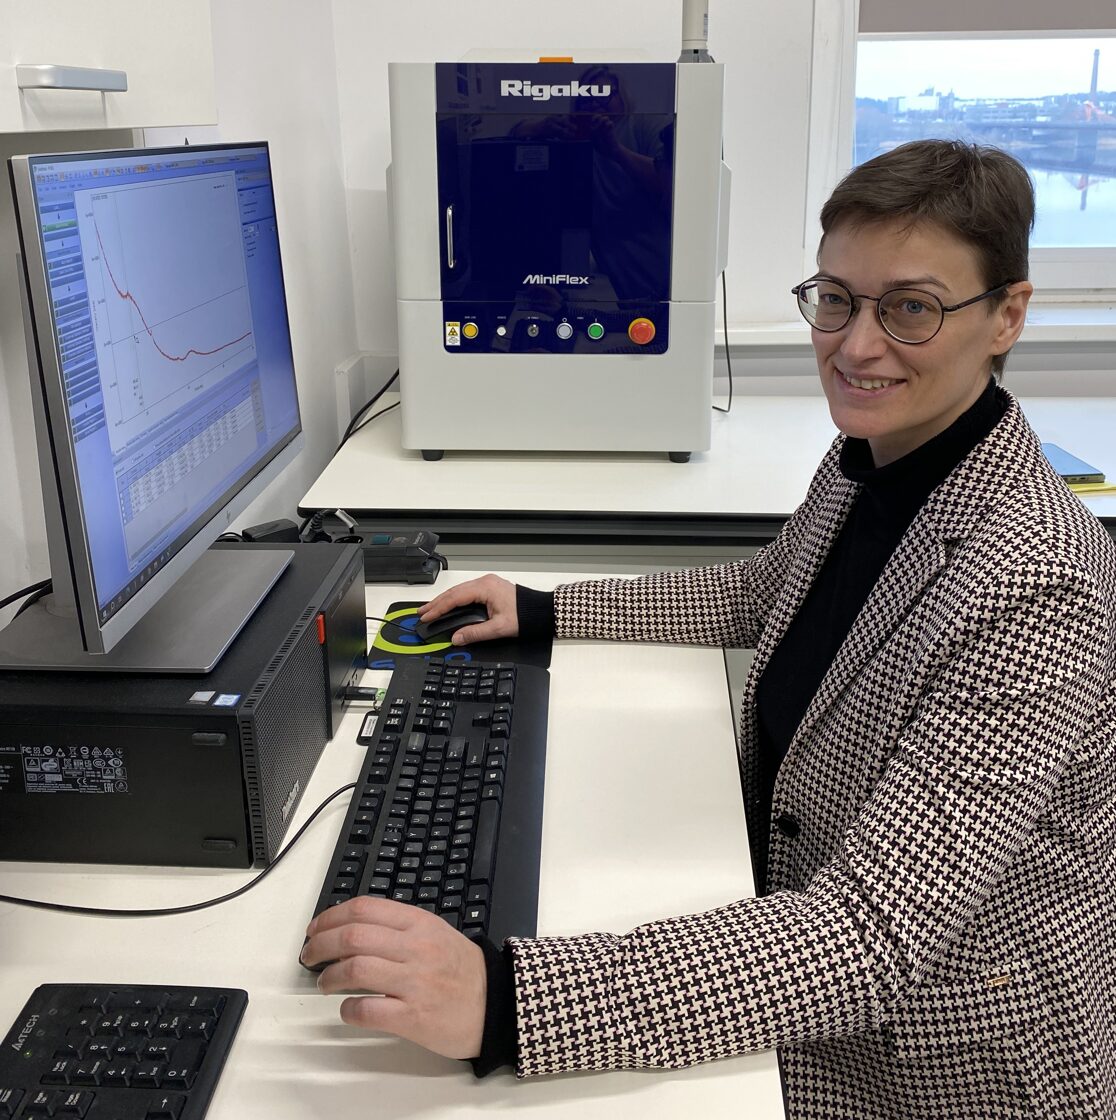
To understand the structure of activated carbon, Līga Grīnberga at ISSP UL employs X-ray Diffraction (XRD) and Raman Spectroscopy, revealing the hidden world of this unique material and its potential use in supercapacitor production.
To determine the order of the carbon structure, an X-ray Diffraction (XRD) analysis is performed using a Rigaku MiniFlex 600 diffractometer. This technique involves ‘shooting’ X-rays at the sample and analysing how they scatter. If sharp peaks appear in the diffraction pattern, it indicates that the biochar contains graphite-like crystalline domains. A more diffuse pattern indicates that the sample has an amorphous, disordered structure. Higher crystallinity in activated carbon can lead to better electrical conductivity, making it a more promising material for supercapacitors. However, other factors, such as porosity and surface chemistry, must also be considered to determine its true usability in energy storage applications.

XRD
diffractogram of different activated carbon samples, showing mostly amorphous
phase with some crystalline domains
To gain deeper insight into activated carbon’s structure, Raman spectroscopy is used to analyze how a laser interacts with the sample. This technique helps distinguish between graphitic (ordered) and amorphous (disordered) carbon, with a key indicator being the D-band to G-band ratio. A higher D/G ratio suggests more disordered carbon, which is beneficial for adsorption and chemical reactivity. On the other hand, a lower D/G ratio indicates a higher graphitic content, making the activated carbon sample a better candidate for energy storage applications, such as conductive materials in batteries or supercapacitors.
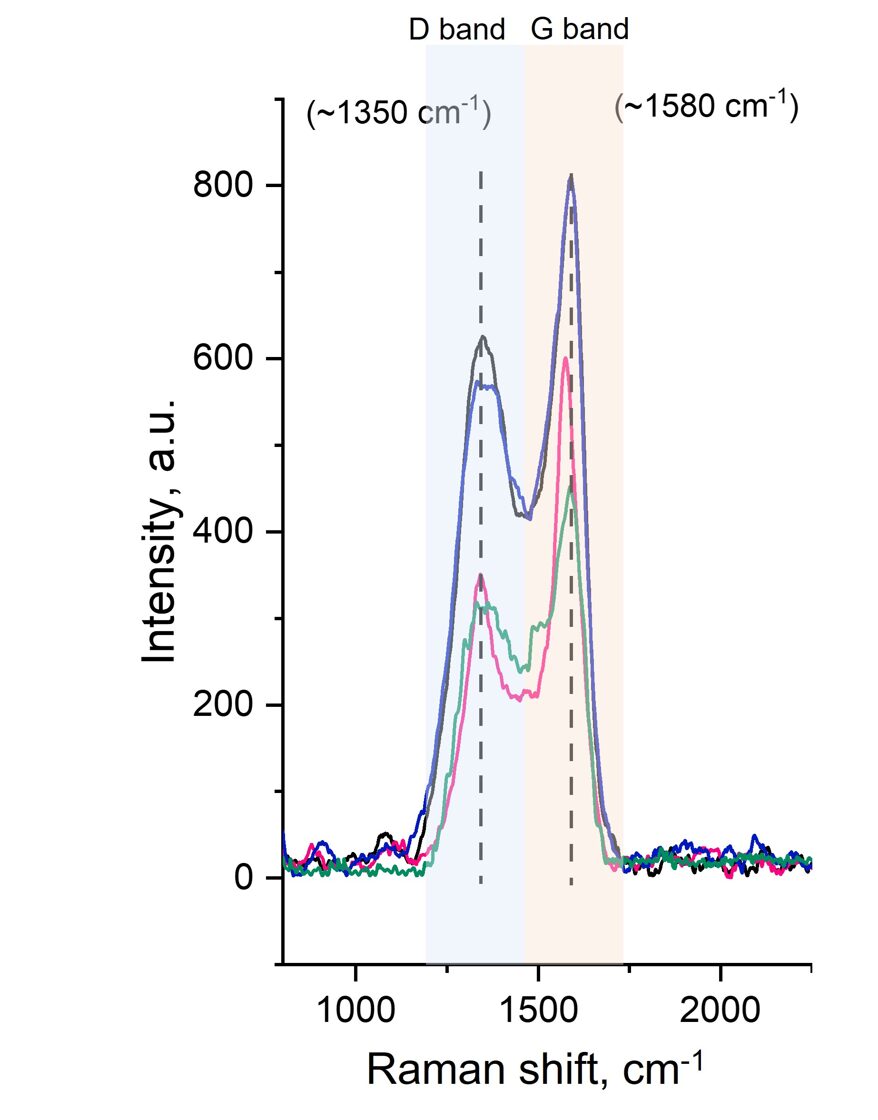
Raman
spectra with indicated D and G band regions of different activated carbon
samples
In the ARMS project, these characterization techniques help to understand how different production conditions—such as temperature, feedstock, and activation methods—impact the final properties of activated carbon. So, the next time you come across a small, blackened piece of carbon, remember—it’s not just a piece of coal; it’s a material full of potential!